
Part 1 of the Java Performance series discussed why Low Latency is Critical and its effect on application performance. In that article, the relationship between latency and application performance is discussed with respect to some of the causes of latency (network issues, disk I/O, operating system, the application code). Also, the problem of high tail latency for applications intended to deliver near-real-time results was presented. This article describes the latency caused by Java/JVM Garbage Collection (GC), and describes in particular how GC can be a cause of high tail latency.
Many modern applications require both high performance and low latency. Performance can be measured as total throughput, the total amount of data that is processed or created over a unit of time. Latency is the amount of time that elapses between each unit of throughput.
Ideally, a program would simultaneously have both consistent high performance and consistently low latency. But it is not realistic to expect this to be possible. For example, consider a program that receives a constant incoming stream of data (these might be satellite measurements, financial market data, data requests into an API, etc.). Changes in the incoming data result in different portions of the code being executed, which can cause significant differences in the amount of time required to process the latest data set. Meanwhile, causes of latency (for example, network I/O and disk I/O) are also constantly varying. Put all this together, and the total latency of a high performance program typically looks something like this:
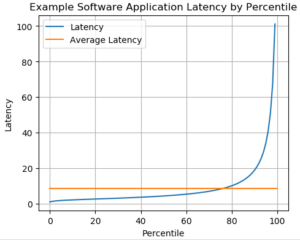
Most of the time, the application’s latency is below the average (the orange line); however, sometimes the latency is significantly above the average. In other words, the application has high tail latency, which is a major problem for customers who require consistent timely performance.
Java’s Innovation Compared with C and C++
A primary reason that Java quickly grew in popularity is that it eliminates the difficulty of memory management that is present in C and C++. These languages are prone to memory leaks unless the code is carefully written to ensure that all allocated memory is freed by the program itself. In operational C/C++ software running on a 24/7 schedule, if a memory leak exists, ultimately all memory available to the application will be consumed, and the application will crash (possibly also bringing down correlated applications running on the same server). Detecting exactly where in the software the memory leak is happening can involve tediously poring over thousands of lines of code. Meanwhile, the application that was supposed to be 24/7 operational has to be restarted, with the operations team knowing that it will likely crash again.
This is the problem that the Java Virtual Machine solves. The JVM automatically manages the application’s memory by monitoring all created objects. This development made developing the same application in Java more efficient than developing it in C/C++. Developers could focus on implementing the required functionality of the software, without spending time concerning themselves with memory issues, and in particular not needing to take time away from new development to debug difficult-to-detect memory leaks.
This is not to say that it’s impossible to create memory leaks in Java: an inexperienced developer might easily write a long-running method that keeps creating new objects, ultimately filling up heap and causing an out-of-memory error. The difference between Java and C/C++ is that this error would be much more easily discovered in Java than a few bytes that are not always freed somewhere in 100K lines of an operational C/C++ code.
What is Stop-the-World in Java?
Through Garbage Collection, the JVM solves the problem of tedious memory management, freeing developers to work on adding new features to their software. The trade-off is garbage collection. As an application is running, the objects stored in memory are constantly changing. Relocating active objects while new objects are actively being created across a multi-threaded application could potentially result in a memory system that is internally inconsistent, which could ultimately cause the application to produce invalid results or crash.
A very safe way to avoid this is called “stop-the-world”: the “world” is all active processing threads. If these are paused, then memory is static, and it’s safe for the garbage collector to identify all active objects and efficiently relocate them without damaging the current processing state of the application. This is why “stop-the-world” has been a feature of historic Java/JVM garbage collection techniques.
Stop-the-World JVM Garbage Collection
The initial concept for Garbage Collection (GC) was to let the application run for as long as it safely could without running out of heap memory. Once the JVM determined that of the amount of heap that was occupied by objects was too near the safe maximum, all application threads would be paused, and garbage collection would occur. Garbage collection, simply stated, performs these operations:
- Pause application threads
- Study all existing objects and determine which are still currently referenced
- Mark the existing objects that currently referenced
- Defragment the heap memory by relocating active objects to the beginning of the heap
- Restart application threads
All of these steps take time. Even pausing multiple threads can occupy quite a lot of time. The threads have to be signaled that they need to pause, then each thread must reach a suitable stopping point. All the threads do not simultaneously come to a pause.
Over time, as multiprocessor CPUs came into being, the possibilities for spreading out stop-the-world GC events, so the application does not have to entirely pause, were discovered and developed. Thus the OpenJDK offers many different options for configuring which type of garbage collection should occur as the application runs.
Among the primary methods for accomplishing this is generational collectors, for example the OpenJDK CMS and G1 garbage collectors. These GCs divide the objects on the heap into two generations: young and old. Young objects are newly created objects that are short-lived: they are created, then the application no longer needs them, so they are easy targets for quick collection by the GC. Old generation objects are often (but not always) objects that endure as the application proceeds. By separating garbage collection between the two generations, GC can facilitate briefer stop-the-world pauses: the memory utilized by unneeded younger objects can be safely collected while the memory for the long-term object remains in place, without the need to pause the entire application.
While the same process can be applied to old generation objects on a less frequent cadence, this is more difficult because these objects are enduring. But they do not necessarily endure forever, and objects from the young generation that are found to be long-lasting will be promoted to the older generation.
Hence, a problem will ultimately arise, based on the size of the memory heap: it will eventually fill up, requiring a full heap garbage collection operation to occur, requiring the JVM to temporarily pause all threads. Suddenly, stop-the-world GC must happen, or else the application will run out of memory. To enable this to happen, all application threads are paused: the application temporarily ceases to perform the processing it is designed to perform.
Stop-the-World GC Creates High Tail Latency
For many types of applications, this is not much of a problem: if your application is effectively “down” every now and then, it makes no difference.
But where the objective is for the application to provide near-real-time performance (for example, financial trading applications, military sensor data processing applications, E-Commerce applications) this is a very big problem. These stop-the-world garbage collection events create enormous high tail latency, which is intolerable for applications that are expected to deliver constant 24/7 real-time performance.
Is there a solution? Yes: replace stop-the-world garbage collection with concurrent garbage collection, which is provided by Zing. I’ll discuss how this works in my next post.