


A while ago, I came across a small Java performance challenge shared by Kirk Pepperdine – one of the most respected experts in the Java performance community, a long-time Java Champion, instructor, and co-founder of JCrete, the unconference that performance enthusiasts from around the world. The code is simple on purpose: validate strings at high volume.
In a laptop benchmark, it looks like “micro-optimization.” At fleet scale it becomes: more instances, more pods, more JVMs, and less headroom. For leadership, headroom is more than a technical buffer; it’s a measure of resilience. When efficiency is low, headroom evaporates, turning every minor traffic surge into a costly auto-scaling event – a “scalability tax” that forces budget expansions just to maintain the status quo. Reclaiming that headroom through code and runtime efficiency doesn’t just save money; it buys you time, resilience, and the ability to scale through peak seasons without doubling your operational footprint. This isn’t about writing clever code. It’s about measuring the cost of “elegant” abstractions under load, and building the habit of eliminating waste before the cloud amplifies it.
Here’s what I measured, what I changed, and what it taught me about performance as a business KPI.
Can you think like a JVM?
If you’ve ever attended one of Kirk’s workshops, you know that his puzzles are never about trick syntax. They’re designed to teach you to think like the JVM – to see the hidden costs behind seemingly innocent lines of code.
The puzzle looked trivial: a short method for validating numbers. Nothing special. But as with many of Kirk’s exercises, the simplicity was the trap. Once I started digging into it, it became less about correctness and more about efficiency – about how easily small, unmeasured design choices turn into invisible waste at scale.
I decided to approach it the same way I’d approach a customer benchmark or a performance investigation:
- Understand the workload. What’s the function doing, how often, and under what data profile?
- Establish a baseline. Measure performance, latency, and understand the load test setup.
- Form hypotheses. What are the likely bottlenecks – exceptions, regex parsing, unnecessary allocations?
- Iterate and compare. Change one thing at a time, verify the result, and document the reasoning.
| Go Deeper: Read my in-depth analysis and step-by-step guide in my companion technical deep-dive article, The Art of Performance Tuning: Why Saving 30% in the Cloud Means Nothing if Your Code Wastes 1000× More. |
From exception storms to regex traps
The first version of the code relied on exceptions for control flow – parsing integers in a try/catch block and treating errors as normal behavior. It worked fine until I fed it datasets that contained invalid values. Then I saw what every Java developer has seen at some point: exception storms. One bad input was cheap. Ten thousand bad inputs were catastrophic.
Why is an exception so costly? It isn’t just the logic in the “catch” block; it’s the work the machine does to capture context. Every time an exception is thrown, the runtime must walk the execution stack to record exactly where things went wrong via a fillInStackTrace() call. This involves crossing the boundary between your application logic and the underlying system, processing metadata that isn’t needed for normal program flow. In a high-traffic system, doing this thousands of times per second turns your CPU into a historian instead of an engine.
So I tried to fix it by validating the input first with a regular expression – a common pattern, and in theory, cleaner. But as soon as I benchmarked it, the results got even worse. The regex engine, with its pattern compilation and backtracking overhead, consumed far more CPU than the simple parser. On one dataset, execution time tripled.
That was my “aha” moment. In isolation, a regular expression feels harmless. But imagine a system where every input validation, log filter, or JSON field check uses regex. Multiply that overhead by thousands of calls per second and hundreds of services. What looks like a neat one-liner suddenly becomes a six-figure line item in your cloud bill.
Imagine a system where every input validation, log filter, or JSON field check uses regex. Multiply that overhead by thousands of calls per second and hundreds of services. What looks like a neat one-liner suddenly becomes a six-figure line item in your cloud bill.
That’s when I started thinking differently:
- What if we don’t need the flexibility of a regex?
- What if we could validate faster by using predictable, low-level operations – simple loops, direct character checks, even custom parsing?
- And more importantly, when is it worth going that far?
Achieving a 50x performance gain
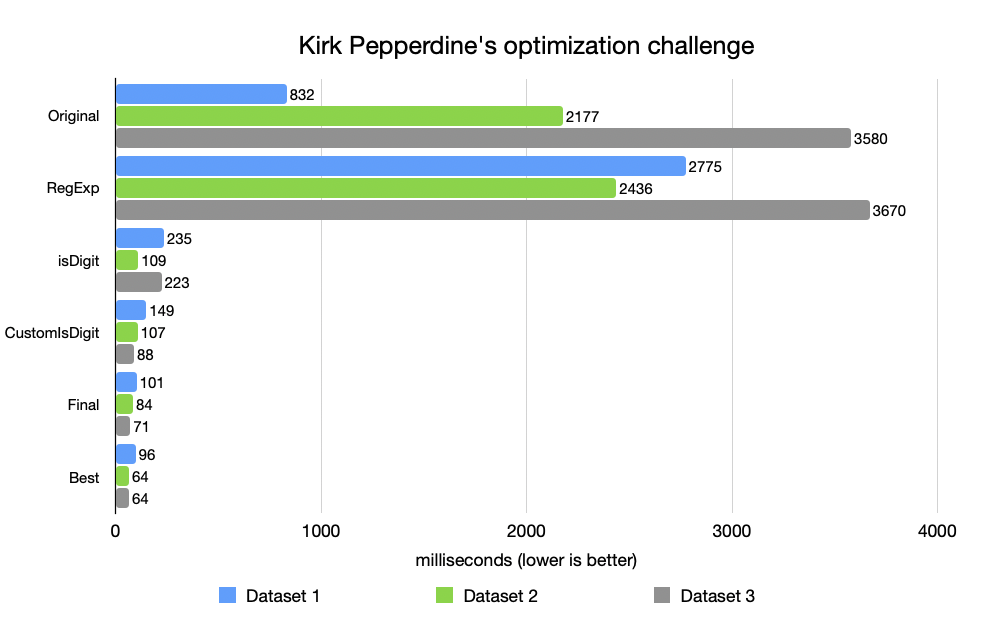
So I experimented. I rewrote the function to use Character.isDigit(), then replaced it with a hand-tuned version that checked ASCII ranges directly. I added a fast integer parser specialized for short numeric strings. I failed fast when the first character didn’t match the expected prefix.
Each iteration shaved off milliseconds, then microseconds, then nanoseconds – until the cumulative improvement reached an order of magnitude. On some datasets, the new implementation was 10× faster; on others, 50× faster [Figure 1].
Was it worth it? It depends. If this function runs once per request in a low-traffic API, probably not. But if it sits on the critical path of a system handling millions of transactions per minute – payment validation, message ingestion, telemetry parsing – the difference is enormous.
That’s the essence of performance work: understanding where it matters. You don’t need to optimize everything – just the paths that multiply.
And that’s why planning for efficiency early is so much cheaper than fixing it later. Retrofitting optimization into production code is like trying to improve fuel efficiency once the car is already on the highway.
Planning for efficiency early is so much cheaper than fixing it later. Retrofitting optimization into production code is like trying to improve fuel efficiency once the car is already on the highway.
If you’ve ever performed a performance analysis or looked at a flame graph after a production incident, you’ve probably seen the same story – a small, innocent function dominating CPU time, often something that no one ever thought to benchmark.
These graphs don’t lie: waste tends to accumulate in the parts of code we never question because “it works.” Until scale makes it expensive.
Risk of AI-generated inefficiency
This challenge is becoming even more relevant with the rise of AI-assisted coding. Tools that generate code for us are masters of “making it work,” but they often lack the context of the environment where that code will run. When an LLM suggests a snippet, it prioritizes logical correctness over hardware efficiency. In a world where we are generating more code than ever before, we must ask: how will this unvetted logic behave under extreme load? We might be automating the creation of future performance bottlenecks at a speed we can’t manually audit.
That’s what Kirk’s puzzle reminded me of – not just how to make one function faster, but how to see inefficiency early. How to think about code the way a profiler would. How to spot the parts that will silently cost you 10× more tomorrow if you don’t address them today.
And if that level of waste can hide in 10 lines of code, imagine what’s hidden inside the billions of lines powering our cloud workloads right now.
Popular languages meet high costs
Once you start thinking in terms of waste – about the cost of every instruction – you can’t help but notice how deep the rabbit hole goes. Optimizing a small function is one thing. But what happens when the inefficiency isn’t in your algorithm, but in the language itself?
A few years ago, researchers compared 27 programming languages by runtime speed, memory consumption, and energy usage across the same algorithmic workloads.
| Go Deeper: Read the study by Pereira, et al, Energy Efficiency across Programming Languages: How Do Energy, Time, and Memory Relate? |
The results were eye-opening: C and C++ sat at the top, as expected. Java performed well — roughly 1.5–2× the energy use of C – thanks to its Just-In-Time compiler and adaptive optimizations. But Python? It needed around 50× more energy to complete the same task. Ruby, PHP, and Perl weren’t far behind. This isn’t a claim about every real-world workload; it’s what shows up in controlled algorithmic benchmarks.
| Language | Energy Use vs C | Relative Performance | Typical Use |
|---|---|---|---|
| C | 1x | Baseline | Systems. embedded |
| C++ | ~1.2x | Near native | High-performance systems |
| Java | ~1.5-2x | JIT compiled | Enterprise, backend |
| Python | ~50x | Interpreted | Scripting, AI, ML |
| Ruby/PHP | ~40x | Interpreted | Web backend |
Now, combine that data with the latest Stack Overflow Developer Survey. The most widely used languages in 2024–2025 are JavaScript, Python, and Java. The same languages that make development fast and expressive are also – by far – the least energy-efficient.
| Go Deeper: Read the latest Stack Overflow Developer Survey. |
We, as an industry, often talk about “developer productivity” as if it’s free. It isn’t. Every abstraction has a cost. Every garbage-collected runtime, interpreted bytecode, or dynamic type system adds overhead. The more layers we build for developer convenience, the further we move from hardware efficiency – and the bill eventually arrives, labeled cloud spend.
The irony is that we now run these inefficient languages at unprecedented scale. Python drives most machine-learning pipelines. JavaScript powers global front- and back-end workloads. Serverless platforms trigger millions of short-lived invocations per second. Multiply Python’s 50× overhead by that frequency, and suddenly “convenience” becomes a seven-figure line item.
This doesn’t mean we should all rewrite our systems in C. Productivity matters. But it does mean we should be aware of the compounding cost of abstraction. A fast developer isn’t automatically a cost-efficient one. The best engineers learn to bridge the two – to use expressive tools while still thinking like a compiler when it matters.
A fast developer isn’t automatically a cost-efficient one. The best engineers learn to bridge the two – to use expressive tools while still thinking like a compiler when it matters.
For years, the industry accepted a silent pact: Java was efficient to write but fundamentally slower than C. In many workloads, modern JVMs can approach native performance – and sometimes outperform C – but it depends on the workload, the code shape, and tuning. At Azul, we’ve spent years engineering the next generation of Just-In-Time (JIT) compilers, like Falcon, to challenge that assumption. By applying advanced optimizations that were previously only available to static languages like C++, we can take the exact same Java code and optimize it for the specific hardware it’s running on and sometimes outperform C/C++ – but it depends on the workload and tuning.
If we plotted the world’s software energy consumption today, most of it would come from interpreted or managed languages — not because we lack alternatives, but because our priorities shifted from performance to velocity. That trade-off made sense when compute was cheap. In the era of massive cloud bills and sustainability targets, it’s worth questioning whether it still does.
| Go Deeper: Read Azul Solutions Engineer Anthony Layton’s blog post, Sustainability Starts with Your Runtime: Meet a Green JVM. |
Beware the cloud convenience trap
Cloud computing democratized access to infrastructure. Instead of overprovisioning servers, we pay only for what we use. On paper, it’s perfect: elasticity as a service. But the truth is that elastic waste is still waste – just billed per second instead of per month.
Consider AWS Lambda. Serverless computing was designed to make idle cost zero. But misused, it makes active cost unbounded. In one case documented by Lydtech Consulting, simply running Lambda functions inside a Virtual Private Cloud caused massive NAT Gateway charges – not from the compute itself, but from networking overhead. It’s important to remember that NAT Gateway costs are driven primarily by a “per-GB processed” charge. When inefficient, chatty code moves unnecessary data across network boundaries, it isn’t just wasting cycles; it’s directly inflating the networking portion of your bill. AWS itself has warned about “serverless illusions” — cases where function orchestration or persistent triggers lead to unexpected spending spikes.
| Go Deeper: Read The Hidden Cost of AWS Lambda: NAT Gateway Charges by Lydtech Consulting. |
The lesson is simple: the cloud makes scaling easy, and scaling hides inefficiency. An inefficient function that used to saturate one machine now saturates hundreds, automatically. Autoscaling policies don’t ask whether your code is efficient — they just replicate it until the load stabilizes.
I’ve seen this pattern firsthand in production: a microservice that looked harmless in development became the top cost driver in production. Why? Because it was doing small things inefficiently – a regex here, a redundant JSON parse there – thousands of times per request. The team scaled infrastructure to handle traffic, unaware they were scaling inefficiency itself.
Serverless and containerization are remarkable tools when used well. But they’ve shifted the developer mindset from “how efficient is this?” to “how scalable is this?” The two used to be related. Now, they’re treated as opposites. That’s a cultural blind spot – one that infrastructure automation can’t fix.
Optimizing everything except the code
Walk into any large enterprise’s FinOps dashboard, and you’ll see the same pattern: EC2 right-sizing, Spot instance utilization, volume cleanups, and idle resource shutdowns. We’ve turned cost optimization into a mechanical process. We have tools that continuously tune the infrastructure layer. But inside the applications? The code is treated as immutable – the one thing we rarely question.
And yet, as I discovered through my experiment, that’s where the biggest gains often lie.
Let’s take a concrete example: Apache Kafka. Based on Azul’s published Kafka benchmark [5] under a defined latency SLA and configuration, the results were stark. Kafka on Prime delivered 45% higher maximum throughput and 30% higher usable capacity at the same latency SLA. If you hold performance constant, that translates directly to 30–40% fewer brokers – and therefore potentially 30–40% lower infrastructure cost. This “free performance boost” is largely due to our Falcon JIT compiler, which uses more optimizations like aggressive vectorization and inlining than standard runtimes. If you could drop your cloud bill by simply swapping your Java runtime , with no code changes required, why wouldn’t you?
| Go Deeper: Read Apache Kafka Performance on Azul Platform Prime vs Vanilla OpenJDK by Azul Product Management Director Jiří Holuša. |
No code change, no redeployment, no feature trade-offs. Just a more efficient runtime.
Now imagine if that same philosophy extended to the application layer: profiling and refining core services with the same discipline we apply to EC2 instance types. How many teams could reclaim 20%, 30%, even 50% of their compute budget simply by understanding how their code actually behaves at runtime?
How many teams could reclaim 20%, 30%, even 50% of their compute budget simply by understanding how their code actually behaves at runtime?
Instead, we chase short-term wins. We containerize waste. We right-size inefficiency. We install FinOps dashboards that measure spend, not why we spend. We are optimizing around the problem instead of inside it.
When I look at performance graphs for customer workloads, I often see recurring patterns: high GC activity from poor object management, frequent de-serialization from redundant data models, or hot loops dominated by built-in library calls that were never meant for critical paths. These are not exotic problems – they’re everyday ones. But they’re invisible until someone looks.
Infrastructure gives you elasticity; efficient software gives you longevity.
The human side of inefficiency
If all of this seems obvious, why doesn’t it happen more often? The answer isn’t technical – it’s organizational.
In most companies, developers aren’t rewarded for saving money. They’re rewarded for delivering features. Even when cloud bills reach eye-watering numbers, optimization tends to be someone else’s job – a late-stage FinOps concern, not an engineering responsibility.
A Virtasant report on FinOps culture called this out directly: “FinOps fails when it’s treated as a finance function instead of a cultural one.” Incentives drive behavior. If cost reduction isn’t measured or rewarded, it simply doesn’t happen.
| Go Deeper: Read the Virtasant report on FinOps culture, Adopting FinOps Balances Growth, Reliability, and Security. |
Consider a thought experiment: If a developer finds a way to save $5 million a year in cloud spend through a smarter algorithm or runtime improvement, how should that person be rewarded? In most organizations, they’d get a “nice job” in a Slack thread. But what if they received a one-time bonus tied to the annual savings. Sure, 20% is probably unrealistic in most organizations. But even a 1–5% “share of savings” would be enough to make many developers rethink what they optimize for – and to treat efficiency as a first-class engineering goal, not a nice-to-have.
The point isn’t to propose a universal policy; it’s to highlight how misaligned our incentives are. We’ve built a culture that celebrates velocity but ignores efficiency. We praise teams for deploying fast, not for deploying well. And that mindset costs more than any misconfigured instance type ever could.
Learn from expert tuners
The good news is that efficiency isn’t a mystery. The expertise exists – it just isn’t always leveraged.
At Azul, we work with teams across industries that run large-scale Java systems – from financial trading platforms to e-commerce backends and streaming pipelines. Many of these systems have been tuned for years, but every engagement still uncovers hidden gains. That’s partly because performance engineering is as much an art as it is a science. The Java runtime is an adaptive system: it profiles, compiles, inlines, allocates, and garbage collects dynamically. Understanding how all those layers interact takes time and experience.
That’s where our engineers, many of them Java Champions, come in. Gil Tene, Simon Ritter, and Kirk Pepperdine – names recognized across the global Java community – lead by example. But they’re not alone. Azul has an exceptional roster of Java Champions, including Frank Delporte, Gerrit Grunwald, Pratik Patel, and Geertjan Wielenga. Together, they bring decades of JVM expertise, compiler insight, and production-tuning experience. They work daily with customers and the Java community as architects, consultants, engineers, and technical educators helping them make better decisions long before problems appear in production.
We also dedicate significant time to education. Azul engineers deliver private workshops for customers and public community sessions that demystify JVM behavior. This is where technologies like CRaC (Coordinated Restore at Checkpoint) change the game. Think of CRaC as “SnapStart but for EC2 or EKS.” By allowing a running Java application to pause, save its state to disk, and resume instantly, we eliminate the expensive CPU “warm-up” period where the JIT compiler is frantically trying to optimize code under load. For serverless or auto-scaled environments, this means your instances are efficient from the very first millisecond, not the tenth minute.
Beyond direct collaboration, Azul invests in the broader ecosystem. Through Foojay.io, the community-driven Java portal, developers share guides, benchmarks, and best practices. It’s part of the same philosophy: optimization is communal knowledge, not proprietary magic.
| Go Deeper: Visit foojay.io, a community-driven Java portal. |
The more companies engage with experts – whether internal or external – the more they shorten the feedback loop between discovery and improvement. You don’t need to be a low-level JIT engineer to save money; you just need to know where to look and who to ask.
From runtime to ROI
Performance discussions often focus on speed – how many transactions per second, how low the latency. But when you put those numbers in a cloud context, speed becomes cost. Every millisecond saved is a smaller VM, fewer cores, less energy.
Azul Platform Prime exists to make Java applications run faster and more efficiently – which, in cloud economics, means cheaper. Better JIT compilation, faster start-up, concurrent garbage collection, and lower pause times translate directly into reduced infrastructure. Azul Platform Core reduces licensing cost, replacing expensive Oracle Java deployments with fully supported, TCK-compliant builds. And Azul Intelligence Cloud addresses the human factor – helping teams understand what’s actually running across their Java estate: what versions, what vulnerabilities, what inefficiencies. Visibility is the first step to improvement.
Together, these are not just runtime tools; they’re cost-optimization mechanisms. They take the principles of performance tuning and apply them to every layer – from bytecode to budget.
Efficiency isn’t a “feature.” It’s a form of respect: for the hardware, for the engineers who maintain it, and for the planet that powers it.
Efficiency as the real cloud strategy
Cloud cost optimization used to mean negotiating better rates or moving workloads between regions. Today, it means something different. It means building software that wastes less.
We can keep tuning Kubernetes and chasing FinOps dashboards, or we can start looking at what our applications actually do with all those cores and gigabytes. Because in the end, the cheapest optimization isn’t the one applied at billing time – it’s the one written into the code from day one.
Performance tuning is no longer just about milliseconds. It’s about mindset, economics, and responsibility.
If every developer optimized just 10% of their critical path, global compute demand and cloud cost could drop by billions.
That’s the opportunity in front of us. And that’s what we at Azul are working toward every day: making Java not just the most portable platform, but the most efficient one.


