“Windows NT addresses 2 Gigabytes of RAM, which is more than any application will ever need.” – Microsoft, on the development of Windows NT, 1992
Whilst the above quote is clearly no longer true, one of the misconceptions I often come across when talking to people about Azul’s Zing JVM is how much memory it needs.
Zing uses the Continuous Concurrent Compacting Collector (C4), which, as the name suggests, can compact heap space whilst application threads are active. Zing is different to all other commercial JVM garbage collectors, which will fall back to a full compacting stop-the-world collection of the old generation when required. The real problem with compacting stop-the-world collections is that the time taken to complete the collection is proportional to the size of the heap, not the amount of live data. The bigger your heap, the longer your application pauses will be. Not so with Zing; with Zing we can support very large heap sizes (currently up to 2Tb) without extremely long pauses for GC. The problem is that people seem to make the connection that because Zing supports very large heaps, that’s what you need to make it work well.
Let’s look at a good example of how that is not necessarily the case.
Our friends over at Hazelcast recently published some benchmark results running their software on a two-node cluster first using a 1Gb and then a 2Gb heap, which are certainly not big heap sizes in today’s world. They used this configuration to compare performance using Oracle’s Hotspot and Azul’s Zing JVM.
The full results are in the article, but it’s interesting to look at the highlights. I’ve written about jHiccup before and how useful it is for measuring the true performance of the platform an application is running on since it reports how a real-world client would perceive response time.
To make the comparison a little easier, I’ve selected the worst performing results of each pair of nodes for both heap sizes and then shown Hotspot side by side with Zing.
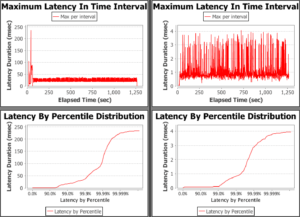
Here are the graphs for the 1Gb heap with Hotspot results on the left and Zing on the right.

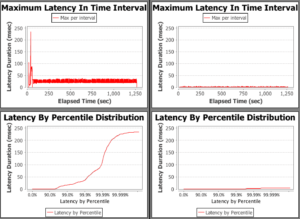
At first glance, this looks like Hotspot is giving better performance than Zing. However, if you look a little closer, you’ll see that the scale of the graphs is not the same. If we normalise the y-axis to give a fair comparison the results look a bit different:

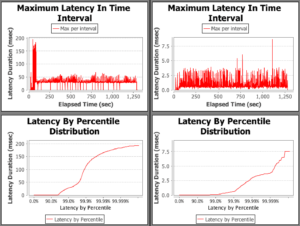
Similarly for the 2Gb heap (Hotspot results on the left, Zing on the right)

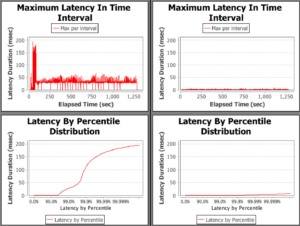
Again, to make a valid comparison we normalise the y-axis:

Putting the key figures into a table:
| Hiccup Time | Hotspot (ms) | Zing (ms) | |
| 1Gb Heap | Maximum | 235 | 4.1 |
| 99.9th percentile | 35 | 0.8 | |
| 2Gb Heap | Maximum | 194 | 8.6 |
| 99.9th percentile | 100 | 1.0 |
What we see here is that Zing massively outperforms Hotspot in this situation, even with these small heap sizes.
Although you could argue that the values in the table represent worst case times and response times for only 0.1% of the application’s runtime, these are still very significant when evaluating how well you meet service level expectations. Let’s compare average hiccup times:
|
|
Hotspot Average Hiccup (ms) | Zing Average Hiccup (ms) |
| 1 Gb Heap | 23.22 | 1.09 |
| 2 Gb Heap | 34.58 | 1.04 |
The conclusion is pretty obvious. If you’re using Hazelcast and are concerned about the latency effects of the JVM the solution is simple: use the Zing JVM. You can try this out for free for twenty-one days; more details can be found here.


