There is a simple reality in computing, which is that accessing data from memory is significantly faster than from disk. It’s just physics. Hard disk drives spin and use a moving head to read and write data to the disk via changes in the magnetic field. Despite high spin speeds and small heads, there is still inertia and momentum to contend with; getting the head to where it needs to be takes time. Although we now see more use of solid-state drives without long seek times, these are still not as fast as dynamic RAM or as cheap as spinning disk drives.
To provide better performance, in-memory processing platforms have been developed. This software keeps all (or almost all) data that needs to be accessed quickly in RAM. One of the most popular software systems for this is Apache Ignite, an open-source project created by GridGain, who did the initial development.
In addition to keeping data in memory for fast access, Ignite uses a distributed approach with clusters of nodes allowing massive scalability. A typical architecture is shown in the diagram below.

Clients send requests to the cluster rather than an individual node directly. The cluster can handle load balancing, and new nodes can be added and removed dynamically as the load changes. For deployment in the cloud, where you are charged for the resources used, this is ideal.
Ignite is written in Java, so can take advantage of JIT compilation to optimise the native code generated. So far, everything seems perfect for applications that need high-speed, low-latency access to data using dynamic queries that make unpredictable access to the data. However, there is one drawback to this scenario when using an OpenJDK JVM: the unavoidable pauses caused by garbage collection (GC). Garbage collectors typically move objects around in the heap, either to tenure them from the young generation to the old or to eliminate fragmentation in the old generation by making live objects contiguous in memory. To do this safely, all standard collectors in OpenJDK will pause application threads during these operations (ZGC minimises pauses but is still experimental). Importantly, the time taken for a full compacting collection of the old generation is proportional to the size of the heap, not the amount of live data. When dealing with in-memory computing, which will typically have very large data sets and therefore large heaps, this can be a serious performance issue.
In Zing, which uses the continuous concurrent compacting collector (C4), this is not a problem. Unlike the other collectors, C4 is truly pauseless; application threads run concurrently (and quite safely) with the object marking and object relocation necessary for GC. More information can be found on the details of Zing, here. In addition, Zing replaces the decades-old C2 JIT compiler with a much more modern and modular JIT, called Falcon. Based on the open-source LLVM project, this can deliver even more optimised code that uses the latest processor features like AVX512 instructions.
We recently reported a use-case for Zing at the In-Memory Computing Summit in California. The results were from a credit card payment system that was using the commercially supported version of Apache Ignite from GridGain.
The configuration for this deployment was as shown below:

The systems used were:
- 3 x AWS i3en.6xlarge (3.1 GHz Intel Xeon Scalable Skylake processors)
- A total of 72 cores
- A total of 576 GB RAM and 45 TB disk
We tested a number of scenarios comparing the use of the G1 collector to C4 in Zing. For this blog post, I’ll focus on the one that provided transactional persistence. When you’re dealing with credit card transactions, that’s probably going to be how the system will be configured.
The customer’s requirements, to determine whether this configuration would work in their real-world deployment, were as follows:
- Each transaction accesses 20 records
- Distributed Transactional Reads
- Target throughput – 1000 reads/sec
- Target latency – 15ms for 99.99th percentile
- Distributed Transactional Updates
- Target throughput – 2000 updates/sec
- Target latency – 50ms for 99.99th percentile
- RAM and disk have to be updated for primary and backup copies
- The run was for two hours
To measure JVM latency, we used jHiccup. This is a simple yet powerful tool, developed by Gil Tene, our CTO. jHiccup adds an extra thread to the JVM being monitored. This does not need to interact with the application code and spends most of its time asleep to avoid the effects of Heisenberg’s Uncertainty Principle (the act of observing something changes what you are observing). The extra thread repeatedly sleeps for 1ms and records any difference between when it expected to wake up and when it actually does. Using the nanosecond resolution of the system timer, we can get highly accurate results.
The graphs below show the results for transactional reads:
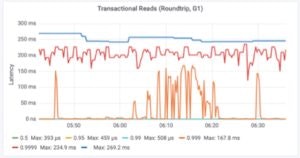
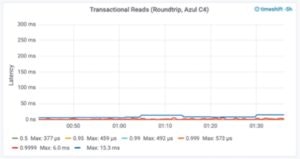
These are the type of graphs that demonstrate perfectly how well Zing solves the problem of GC. The red line is the 99.99th percentile, which needs to be 15ms or less to satisfy the latency goal of the system. Using G1, it is pretty consistently around 200ms, over ten times the goal.
For Zing performance, we need to change the scale of the graph to get a clear picture.
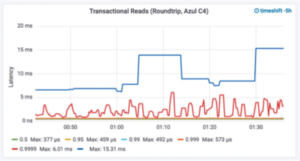
Here we can see that only very briefly does Zing hit 6ms latency in the 99.99th percentile and has a maximum latency of 15.31ms.
What about transactional writes?
This time we’ll use different scales straight away.

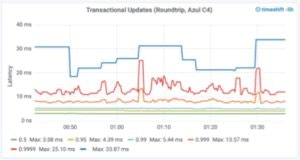
The latency target was a more relaxed 50ms at the 99.99th percentile in this case. G1 latency was slightly worse than with reads, being consistently around 250ms (only 5x the goal) but with some spikes up to 479ms. For Zing, with C4, the maximum at the 99.99th percentile was 25.1ms (half the maximum allowed by our target) and the maximum latency observed was 33.87ms, meaning we never exceeded the target latency.
There are several conclusions we can draw from this data.
- Zing really does solve the problem of GC pauses.
- Zing combined with GridGain delivers the performance the customer needs to run their business. Consistently and predictably.
- To meet the goals of this customer with G1 would require significantly more nodes in the cluster, increasing the AWS bill each month. Using Zing works out cheaper. An easy sell to the CIO and CEO.
If you’re using an in-memory platform (and even if you’re not) why don’t you see how Zing could help your JVM based application perform better using our FREE 30-day trial?


