jRT is an open source tool developed by Azul Engineer Fedor Burdun that provides a quick picture of your applications’ end user response times as they run in production.
jRT is designed to measure the socket response and return time spectrum associated with an application’s network-facing Java runtime platform. The tool captures the time-series and variability of the socket-based application code, underlying Java Virtual Machine (JVM), operating system, hypervisor (if used) and hardware as application response times. The goal is capturing the spread of best-case to worst-case end user responses, from the viewpoint of the JVM reacting to stimulus from connected clients. Data from a jRT session is used ultimately for dynamic histogram analysis through HdrHistogram plots, much like jHiccup.
jRT works as a Java agent with any Java application, on any operating system, and with any JVM with no code changes. When you are trying to characterize the latency behavior of an application, you would use jRT to measure response times of Java applications as they would be experienced by an end user over a network. You would continue to use jHiccup to profile the response times of your application’s underlying infrastructure. Plotting both data side-by-side can reveal JVM issues that affect network response, as well as network response problems not caused by JVM issues.
The plot below shows the correlation between a jRT trace, which shows a spectrum of end user service responses, and how it resembles an outer envelope over the spectrum of internal pauses showed by jHiccup. Typically jHiccup shows the best possible response time in the wake of internal JVM pauses, while jRT shows values more closely correlated to observed end user response times.
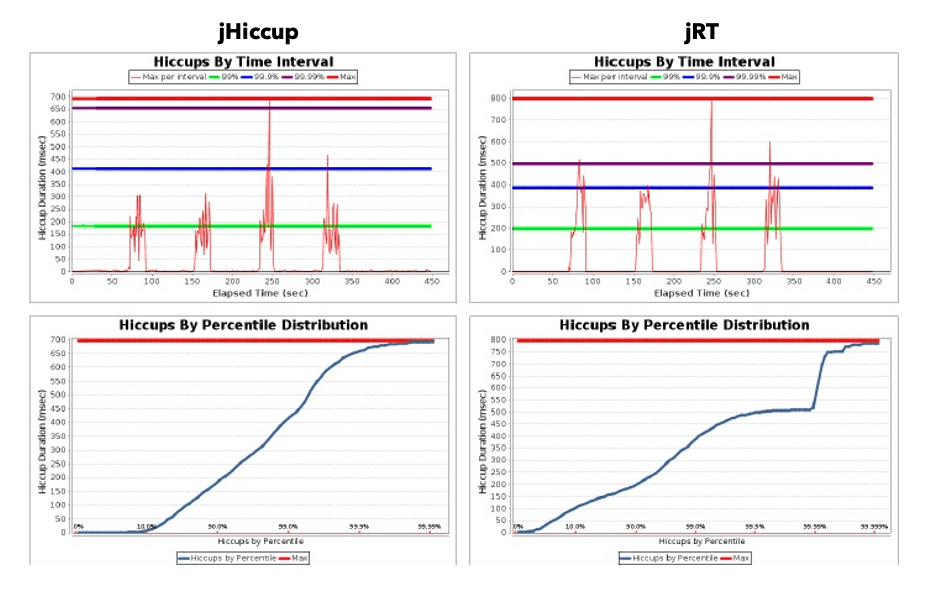
jRT measurement is at the server socket, so does not include the component of client-observed latency contributed by any intervening networks.
The jRT tar file includes the tool source, all documentation and an Excel spreadsheet template for generating graphs. jRT was written by Azul to provide insight into network response times within Java program code, and as a complement to the jHiccup tool, which shows internal JVM latencies. Just like jHiccup, jRT is released to the public domain as explained at https://creativecommons.org/publicdomain/zero/1.0/.
For more information and other download formats, see http://github.com/LatencyUtils/jRT.
jRT works with any Java application, on any operating system, and with any JVM (with no code changes). Use jRT to measure response times of Java applications as they would be experienced by an end user over a network.
For more information on how to run jRT, analyze jRT data or charts, or compare your JVM’s response times with Azul Platform Prime, please refer to the enclosed README file.
Please send us questions / problems at [email protected]