For scalable data workloads like Apache Cassandra, performance and capacity are simply a matter of cost. JVM choice and configuration can dramatically impact that cost. The Azul Platform Prime JVM significantly improves Apache Cassandra performance and reduces the cost of Cassandra clusters.
We set off to characterize the impact of JVM choice and configuration on Apache Cassandra load carrying capacity: the capacity of a Cassandra cluster of a certain size to handle traffic while meeting specified service levels.
Scalable data technologies like Cassandra are great. Within reason, they let us provision as much capacity as we need to carry our workloads by adding horizontally scaling nodes. We can choose the performance and capacity that a cluster would provide. We just need enough nodes. Each node we add to a Cassandra cluster adds both storage capacity and throughput carrying capacity to the cluster.
How Service Level Expectations Affect Apache Cassandra Cost
Nodes are the basic building blocks of Apache Cassandra clusters, and the cost of a node is determined by its type and size. The cost of a cluster, in turn, depends on the number of such nodes that the cluster must use to perform its task to acceptable levels. E.g. a common node type for CPU-bound Cassandra workloads might be an AWS c5d.2xlarge (8 vCPU, 64GB, 300GB NVMe SSD), at an on-demand cost of $0.576/hr, and the cost of a cluster comprised of 20 such nodes would be $11.52/hr, or just over $100K/yr.
The number of nodes one actually needs in a cluster will fundamentally depend on the load carrying capacity we need to provide, and the useful capacity each node contributes. When it comes to useful capacity, the ability to meet expected service levels is key. A cluster’s overall throughput or storage capacity are only effective to the extent that this capacity can practically carry load while expected cluster service levels are maintained. The cluster’s actual provisioned resources (and resulting cost) will necessarily end up being sized to meet service level requirements.
How JVM Choice and Configuration Affect Cassandra Cost
JVM choice and configuration can dramatically impact both code speed and response time consistency. The combined effects of modern JVM, JIT, and Garbage Collectors technologies can be observed in the throughout and responsiveness experienced by Cassandra clients. JVMs that can maintain reliably fast and responsive code speed at high throughputs can improve Cassandra’s load carrying capacity for a given hardware configuration, reducing cluster costs.
JVM configurations that are unable to sustain expected responsiveness levels at significant fractions of their full throughput potential will invariably lead to “overprovisioned” clusters with seemingly underutilized nodes, as driving significant utilization levels with such JVMs leads to service level collapse.
Establishing a Cassandra Cluster’s Load Carrying Capacity
Establishing the load carrying capacity of a given cluster configuration is quite simple, if somewhat time consuming: Drive the cluster at various throughout levels between 0 and some highest achieved throughput level, each for sustained period of time, and determine the highest throughout that the cluster, as configured, can reliably sustain while maintaining stated service level expectations.
Our Example Workload
For our tests, we chose to use the same tlp-cluster setup and the same TLP stress workload examples that Datastax has previously used in benchmarking Cassandra 4.0.
Our Example Service Level Expectation Specification
We imagine a service serving clients that time out queries at 100msec, and would have to resort to alternate actions or to errors if queries took longer than that to complete. Our specified service level expectation is that (in a fully provisioned and warmed up cluster) less than 0.1% of client queries in any given 10 second period would result in a timeout. This expectation requires that the actually experienced 99.9%’ile in all 10 second periods during the load test remain below 100msec. E.g. at a query rate of 10K queries/sec, this would represent the fairly relaxed expectation of experiencing no more than 100 timeouts in any 10 second period.
Since measurement and modeling of actually experienced 99.9%’ile in all 10 second periods is needed, we used a slightly modified version of tlp-stress to gather our service level indicators. We established the modeled client-experienced query response times at various percentile levels and under varying loads for all tested JVM configurations.
Run Length, Warmup Period, and Repeated Run Count
We chose to use a post-warmup sustained load test period of 2 hours under each throughput and JVM configuration because early tests showed that shorter test periods would often miss service level degradations resulting from sustained work.
To ensure measurement of service levels was done in well-warmed configurations, each sustained throughput level test was run separately on a freshly configured cluster for a total of 150 minutes (2.5 hours). The first 30 minutes of each cluster’s life was treated as a warm up period, and the experienced service levels were considered during the 120-minute post-warmup period of each run.
Finally, because of exhibited run-to-run variance, we chose to perform 5 repeated runs in each configuration and load level. This ensures that expected service levels were reliably met across all runs at a given load, and not just in some.
JVM Configurations
We compared five Java 11 JVM configurations:
- Azul’s Prime 11.0.13 JDK (which uses the C4 Garbage Collector)
- OpenJDK 11.0.13 with the following garbage collectors:
- G1
- CMS
- Shenandoah
- ZGC
We chose to use 40GB heaps for the Cassandra nodes because this heap size exhibited higher achievable throughputs (ignoring service levels) for the various JVM configurations, as well as higher load carrying capacity for the JVM configurations that were able to meet the 100msec service level requirements.
Load Test Detail
Our tests all used a tlp-stress benchmarking configuration similar to the one described in the aforementioned Datastax blog entry:
Cluster Information
- Cassandra 4.0.1
- 3 node cluster, r5d.2xlarge instances
- 40GB heap
- Replication factor = 3
- Consistency level LOCAL_ONE
Load Generator Information:
- One c5.2xlarge instance
- 8 threads with rate limiting
- 50 concurrent queries per thread
- 80% writes/20% reads
- Asynchronous queries (tlp-stress uses asynchronous queries extensively, which can easily overwhelm Cassandra nodes with a limited number of stress threads)
The following tlp-stress command was used:
tlp-stress run BasicTimeSeries -d 150m -p 100M -c 50 --pg sequence -t 8 -r 0.2 --rate <desired rate> --populate 200000 --response-time-warmup 30m --csv ./tlp_stress_metrics_1.csv --hdr ./tlp_stress_metrics_1.hdr
All workloads ran for 150 minutes, allowing compaction loads to be exhibited during the runs.
Throughput Levels Tested
In early testing, we established that the highest throughput (for the combined 80% writes/20% reads workload) that any of our configurations were able to achieve, regardless of service level expectations, was below 120k ops. Armed with the knowledge of that upper bound, and with access to readily available public cloud resources, we proceeded to perform a multitude of prolonged tests, testing all JVM configurations at attempted throughput levels ranging 20k ops and 120kops, in increments of 10k ops, and documented the results. Altogether, these tests represent a total of 275 separate cluster runs (5 JVM configurations, 11 load levels between 20K and 120k ops, 5 runs each) lasting 2.5 hours each.
Apache Cassandra with Azul Platform Prime Results
Raw achieved throughput (ignoring service levels):
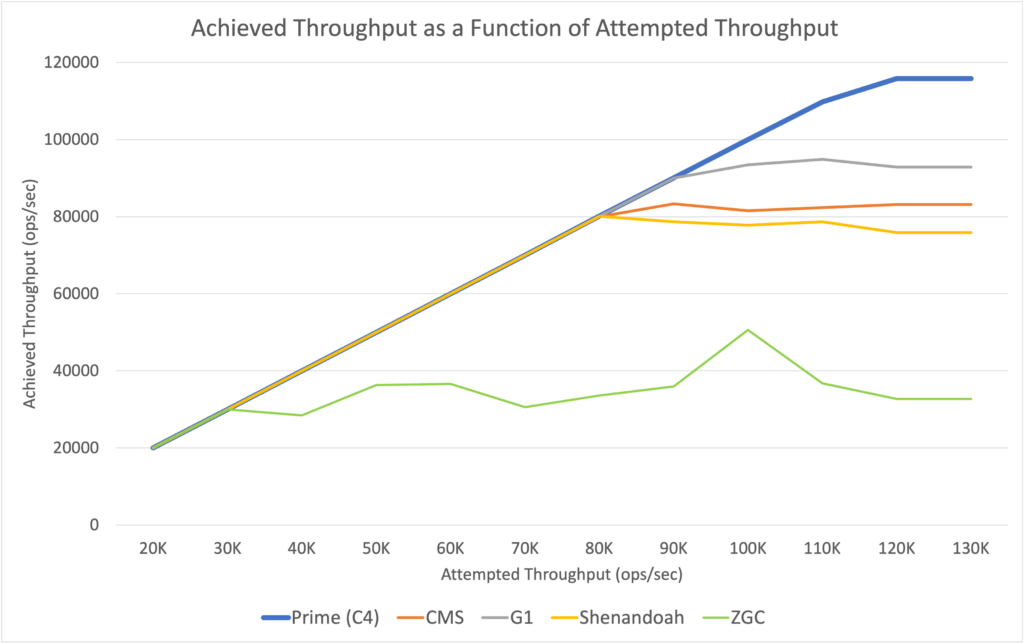
While not directly indicative of a configuration’s ability to carry load while maintaining service levels, observing actual achieved throughputs under various attempted throughput levels (without considering service levels) can be informative. We found the following behavior for the JVM configurations tested:

| Configuration | Highest Achieved Throughput (ops/sec) |
|---|---|
| Azul Platform Prime 11 | 115,865 |
| OpenJDK 11 CMS | 83,305 |
| OpenJDK 11 G1 | 94,850 |
| OpenJDK 11 Shenandoah | 80,085 |
| OpenJDK 11 ZGC | 50,630 |
While most of the tested JVM configurations were able to consistently sustain the requested throughput all the way to their highest achieved throughout levels, the next set of results shows that the same cannot be said for sustaining the required service levels.
Load carrying capacity (the highest throughput at which service level requirement were reliably met)
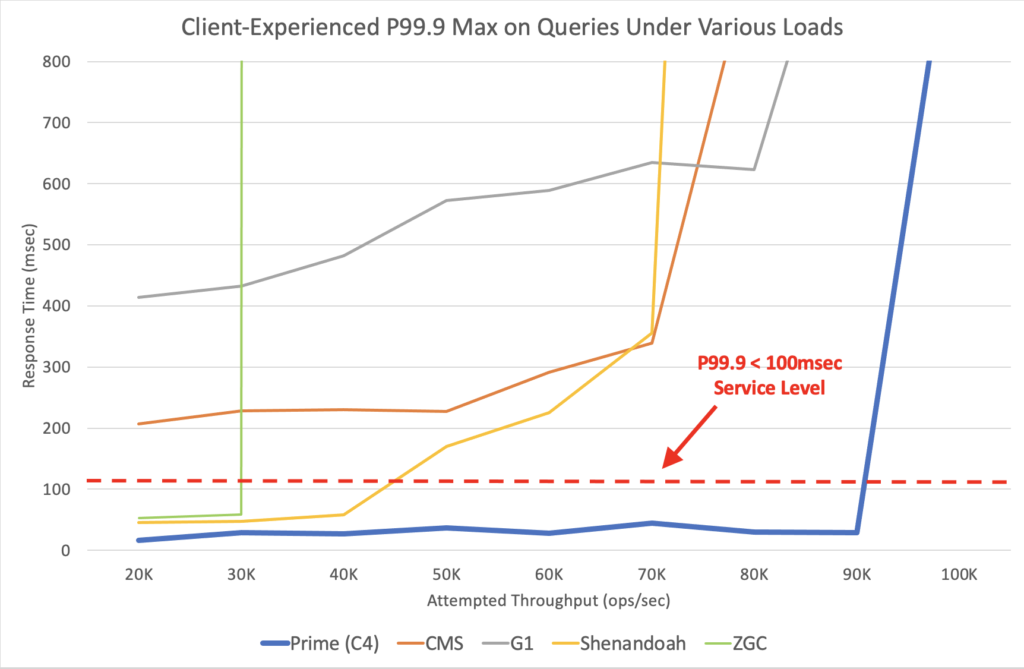
As one would expect, as load is increased for a given configuration, there is a point where the configuration’s experienced service levels collapse and stop meeting requirements. The point at which this failure occurs varied widely between JVM configurations, with some unable to meet the stated service levels even at relatively low loads, and others able to sustain service levels at rates that were a significant fraction of their highest exhibited throughout. Low pause collectors (C4, Shenandoah, and ZGC) were all able to maintain the required service levels at non-trivial throughputs, but the throughputs to which they could be driven while doing so varied dramatically. The following chart and table detail these results.
Client-Experienced P99.9 Max on Queries Under Various Loads
| Attempted Throughput | Azul Platform Prime | OpenJDK CMS | OpenJDK G1 | OpenJDK Shenandoah | OpenJDK ZGC |
|---|---|---|---|---|---|
| 20K | 16.4 | 207 | 414 | 45.2 | 53.2 |
| 30K | 28.4 | 228 | 432 | 47.6 | 58.7 |
| 40K | 26.9 | 230 | 482 | 58.1 | 1041760 |
| 50K | 36.5 | 227 | 572 | 170 | 988283 |
| 60K | 28.1 | 291 | 589 | 225 | 1405092 |
| 70K | 44.1 | 339 | 635 | 356 | 2028995 |
| 80K | 29.8 | 989 | 623 | 3865 | 1223688 |
| 90K | 28.5 | 171049 | 1174 | 410518 | 1262486 |
| 100K | 1125 | 414974 | 118161 | 522191 | 811074 |
| 110K | 11682 | 537395 | 284688 | 638058 | 1413480 |
| 120K | 96338 | 660603 | 457179 | 802161 | 1535115 |
This is best depicted in a chart:

Additional results detailing the client-experienced P50 Max, P90 Max, and P99 Max on queries performed under these same set of load levels, collected during the same set of test runs, can be found here.
Summary
As can be seen in these results, Azul’s Platform Prime is fast. It is by far the highest throughput JVM for powering Cassandra, based on pure throughput alone. It also exhibits better response times and latencies, at pretty much any percentile, than any other JVM.
But the combination of throughput and responsiveness is where Azul Platform Prime really shines: the ability to maintain good response time behavior closer to its highest achievable throughputs, and far beyond those that make other JVMs start to fail service levels on the exact same node type. This ability allows Cassandra, when run on the Prime JVM, to extract more useful capacity out of every node: to drive individual nodes to higher throughputs and higher utilization levels before service levels are compromised.
In the real world, this translates to fewer nodes needed when carrying the same Apache Cassandra workload, and to a lower cost.
How much lower? Obviously, your mileage may vary depending on your Cassandra workload and service level requirements.
For the workload and service levels detailed above, Azul Platform Prime exhibited a load carrying capacity that is at least 2x better than any other JVM configuration tested on the exact same configuration of AWS instances. This means a cost that is more than 2x lower.
Want to learn more? Feel free to contact us. We’re happy to assist you when trying out Azul Platform Prime. As an alternative, Azul Platform Prime is available for free for testing and evaluation purposes via so called Stream builds. The easiest way how to see the benefits is to download them and try it yourself. Make sure to stop by at the Prime’s Foojay community forum to provide us the results what you see.


