


Summary
Determining the ideal memory size for Java applications can be challenging, but it’s critical to achieve maximum performance. Using the garbage collector (GC) log files can help determine the required memory size for a Java application. The GC can keep the memory use of Java applications as low as possible, find problems in the code, and help define the right dimensions for your servers or virtual environments. The Garbage Collector Logging provides the correct metrics to check how much memory an application needs.
In this post you will learn:
- How to test, an important step in application development and deployment
- Creating a test with JMeter GUI
- Differences in GC logs between Azul Zing and Zulu Builds of OpenJDK
Determining the ideal memory size for your server or virtual instance to run a Java application can be challenging. But with the rising cost and ecological impact of cloud instances, it’s important to dimension your machines correctly to handle the expected load without over-dimensioning so you can minimize the cost of the machine and reduce its ecological impact. Understanding an application’s memory size requirements is important to achieving maximum performance at the lowest operational cost.
In this post, we will use the garbage collector (GC) log files to determine the required memory size for an application. Thanks to the Java runtime, we can rely on the GC to clean up the memory that is no longer used and keep the overall amount as low as possible. While doing this, the GC can output a log file with a lot of info that can help us to find both problems in the code and also help us to define the right dimensions for our servers or virtual environments.
| Related Posts |
|---|
| Best Practices for Ramps in Performance Tests discusses the importance of running your tests long enough to ensure that you measure the load of a fully warmed-up application. Configuring Spring Boot to Build a Docker Image with Azul Zulu and Debug Options with more information about using Azul Zulu in a Docker Image and getting JFR and GCLog results. Does Java Garbage Collection Logging Impact Application Performance? A post about the many benefits of GC Logging. You can learn a lot from always having the log files available. |
How to test your application
The hardest but most important part of a real-life-test is having a repeatable load test that resembles the application’s actual use. This is an important step in developing and deploying an application and requires cooperation between your Dev and DevOps teams. There are a few important points to keep in mind when setting up a test to define the amount of memory an application needs. They also apply in other cases, such as when testing the maximum throughput.
- Take your time: When a Java application is executed, the JVM recompiles the most used bytecode (class files) to native code. This process takes some time (known as the warmup time), so you need to wait until your application has been used for long enough with the typical load you expect. The application must call all the code it should, based on the load that has been put on the application.
- Be careful with local tests: Some tests can be easily executed on your own machine, but be aware of the load of the test itself! Executing a load test on the same machine that runs the application can cause CPU and/or memory overload that impacts the performance of the application under test.
- Use a real-world test: A test is valid only when you can simulate the expected load in an environment similar to your production system.
- Test in production: GC Logs have minimal impact on your system’s performance. In many cases, this is a far easier and cheaper solution to getting real-life log results than setting up a full test environment.
Experimenting with Spring Petclinic
I used the Spring Pet Clinic application to gather test results for this post. The sources are available on GitHub and include a JMeter test script.
Running the test application
To follow this approach, get the source code, compile the application, and start it, using the following commands:
# Get the sources
$ git clone https://github.com/spring-projects/spring-petclinic
$ cd spring-petclinic

# Generate a JAR and run, use CTRL+C to stop the application
$ ./mvnw package
$ java -Xlog:gc,safepoint:gc.log::filecount=0 -jar target/*.jar
Your application is now configured to store the garbage collection logging in a single file. This setting is ideal for the test in this post. But when enabling GC Log in production, you should use rolling files to prevent the file from becoming too big and filling your storage space. For instance, use -Xlog:gc,safepoint:gc.log::filecount=10,filesize=100M to set the log rotation to a maximum of 10 files of 100MB each. When you don’t define filecount and filesize, the default is five files of 20MB each, so GC Logging won’t use more than 100 MB.
About JMeter
The Spring Petclinic project contains a JMeter test. Such a test can be executed with Apache JMeter, a 100% pure open-source Java application designed to load test functional behavior and measure performance. It was initially designed for testing Web Applications but has since expanded to other test functions. Check the latest version and download it.
$ cd ~/Downloads
$ wget https://dlcdn.apache.org//jmeter/binaries/apache-jmeter-5.6.3.zip
$ unzip apache-jmeter-5.6.3.zip
$ rm apache-jmeter-5.6.3.zip
JMeter tests can be executed with the GUI application, but this is not advised as it introduces the risk of the GUI impacting the test’s performance. The GUI should only be used to create a test or run it to validate its configuration.
Creating a test with JMeter GUI
- Start the Apache JMeter GUI application:
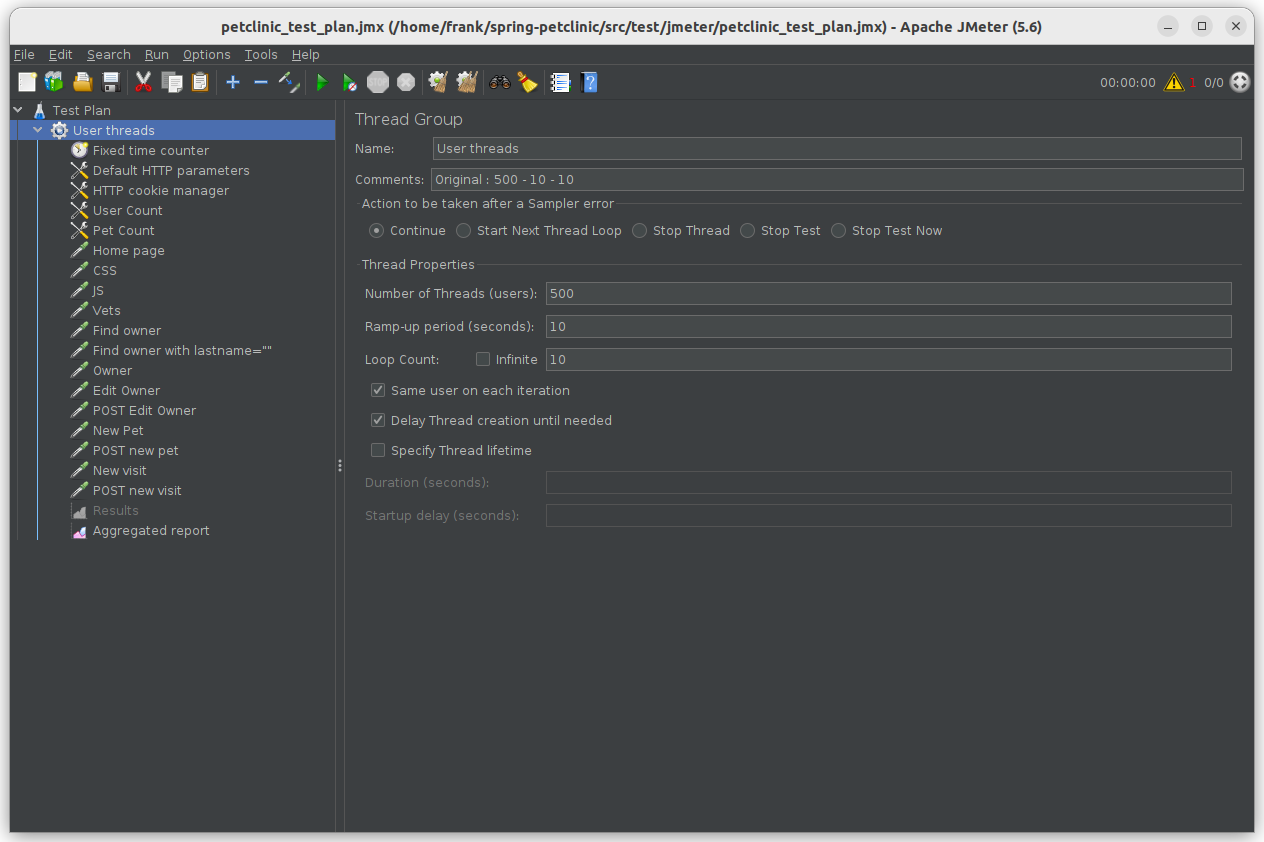
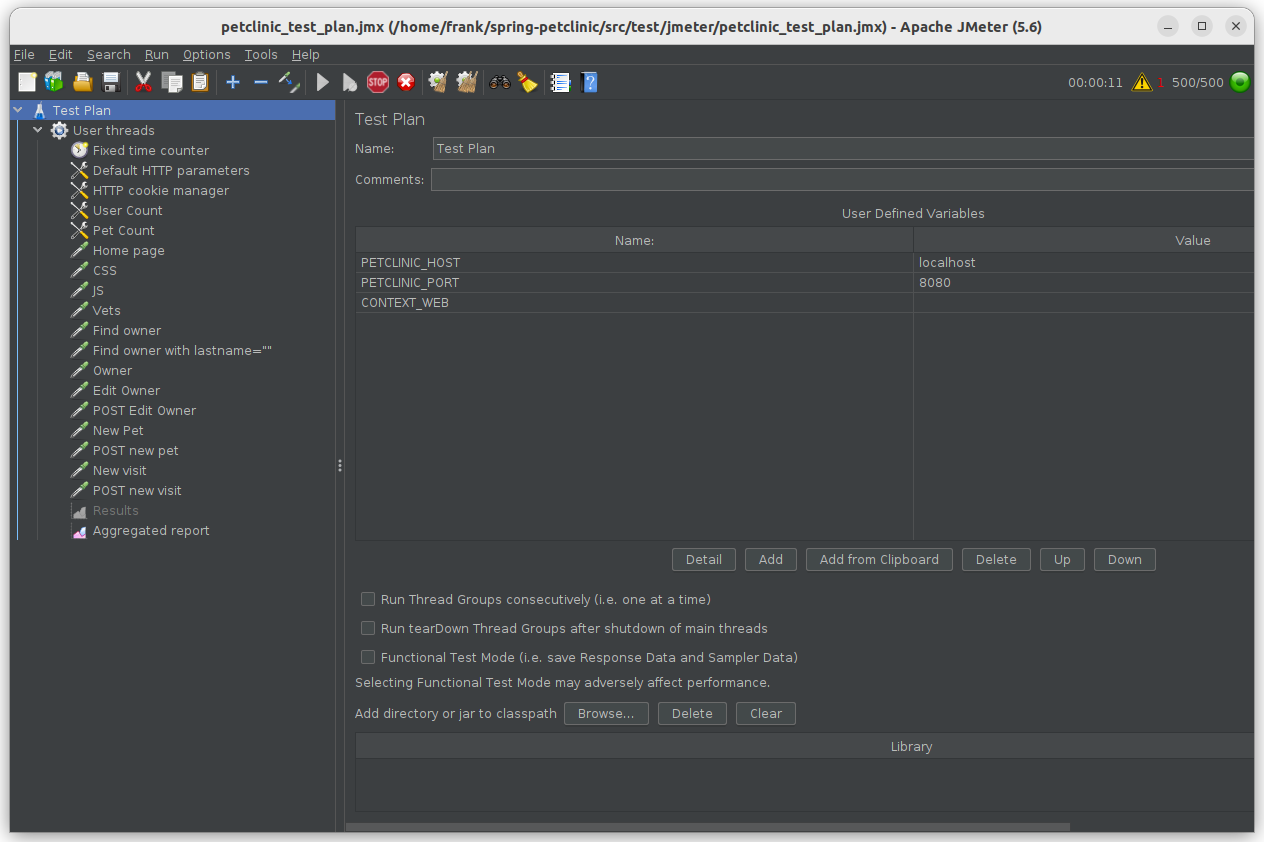
$ java -jar ~/Downloads/apache-jmeter-5.6.3/bin/ApacheJMeter.jar- In the UI, click File > Open, and select the file
spring-petclinic/src/test/jmeter/petclinic_test_plan.jmx. - You can execute the test to validate the configuration by hitting the Start button, which will start threads to simulate 500 users.
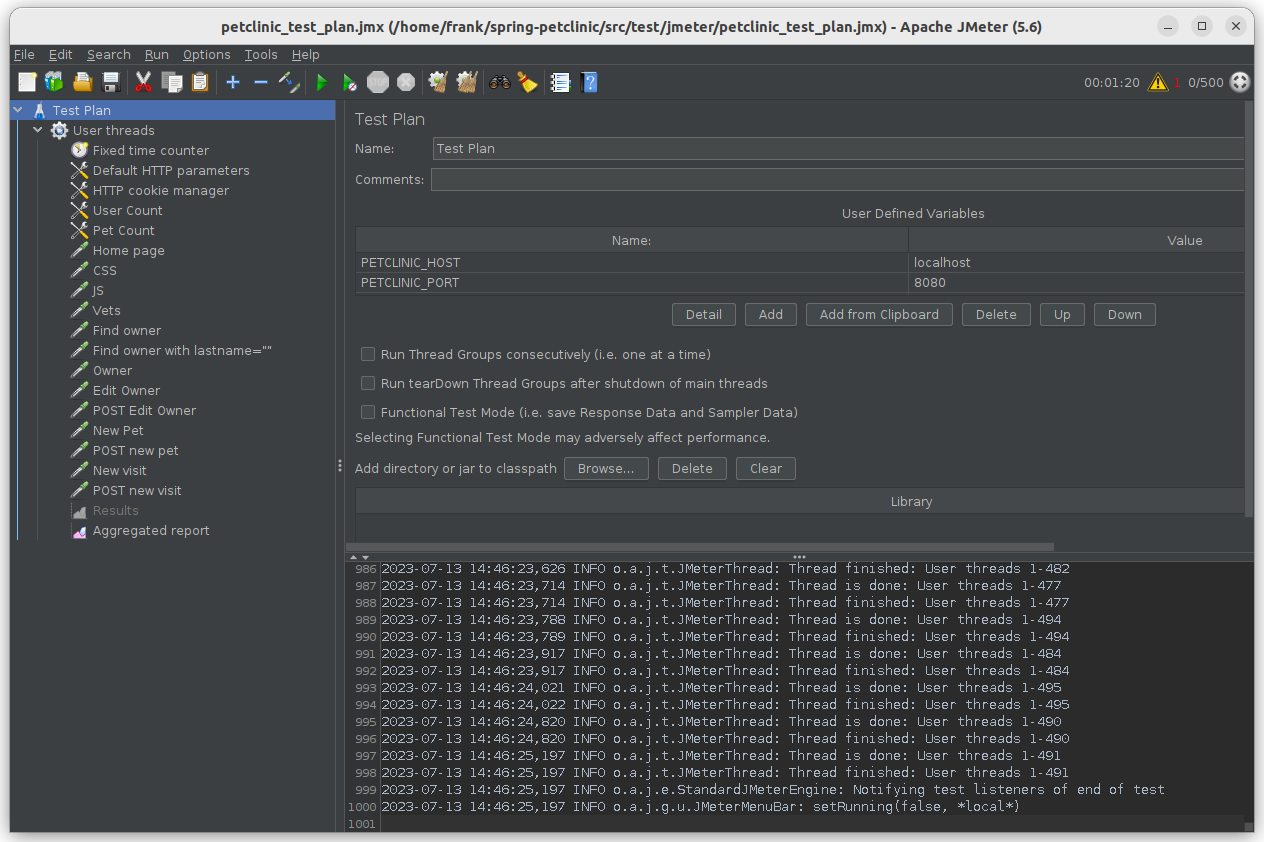
- Let it run until the test is finished. The number of active threads will drop from 500 to 0.
Running the load test with JMeter In headless mode
For the actual test, we will execute JMeter in headless mode. In my case, I execute the test on the same machine that is running the application because it has enough memory and CPU to handle both. Make sure this is valid for your test when using this same approach!
Let’s run a test and generate a report with the following options:
- -n: run in headless mode (no GUI)
- -t: the path to the .jmx test script to be executed
- -l: the path to the .jtl file to store the raw results
- -o: the path to the output folder to generate the report dashboard after the load test, which must be empty
- -e: generate report dashboard after load test
$ java -jar ApacheJMeter.jar -n -t spring-petclinic/src/test/jmeter/petclinic_test_plan.jmx -l jmeter.jtl -o jmeter-report/ -eWhen you don’t add the -e option, you can still generate an HTML report later based on the .jtl file created during the test run
- -g: the path to the .jtl file generated during the test
- -o: the folder to store the HTML report
$ java -jar ApacheJMeter.jar -g jmeter.jtl -o jmeter-report/As each new Java runtime version brings performance improvements, it’s important to know which version is used on your production system. I executed my tests with Azul Zulu Builds of OpenJDK, version 21.0.3.
$ java -version
#openjdk version "21.0.3" 2024-04-16 LTS
#OpenJDK Runtime Environment Zulu21.34+19-CA (build 21.0.3+9-LTS)
#OpenJDK 64-Bit Server VM Zulu21.34+19-CA (build 21.0.3+9-LTS, mixed mode, sharing)
Reading the JMeter report
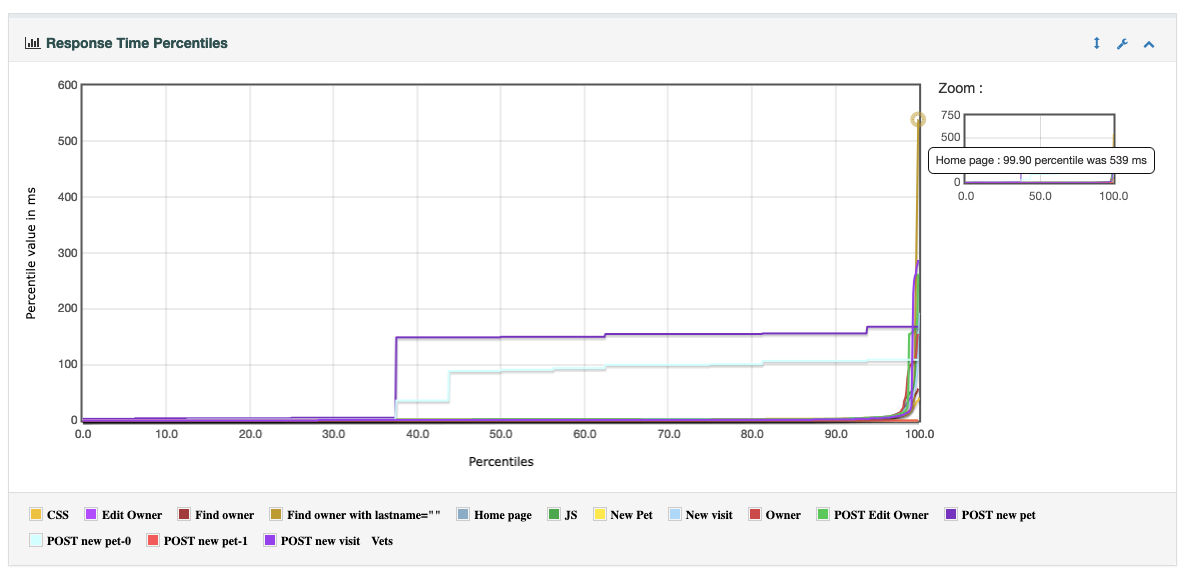
Within the JMeter HTML report directory (jmeter-report/ in my case as specified with the -o parameter), you can find a website with the results of the JMeter test. You won’t find any memory-related info here, but the results of the tests that are defined in the JMeter test file. For example: Response Time Percentiles, Throughput in Hits Per Second, etc.
Inspecting the GC log results
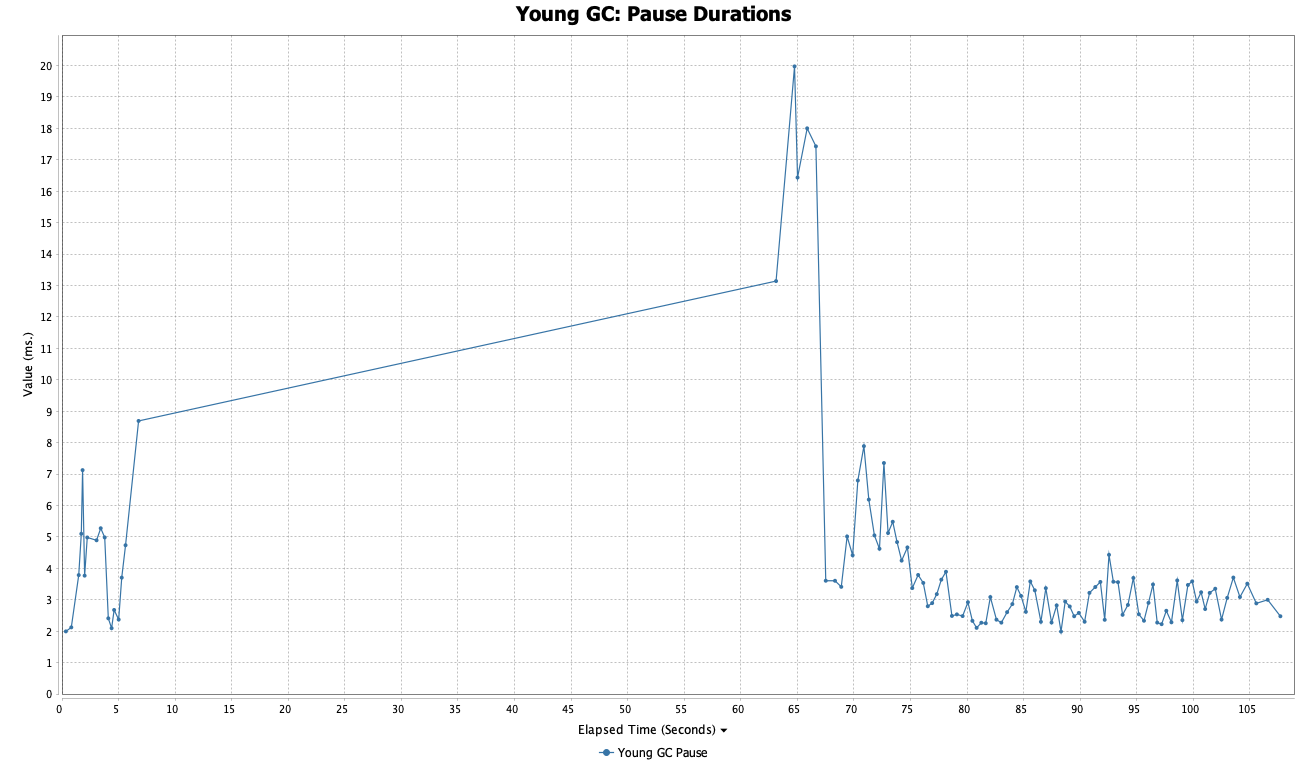
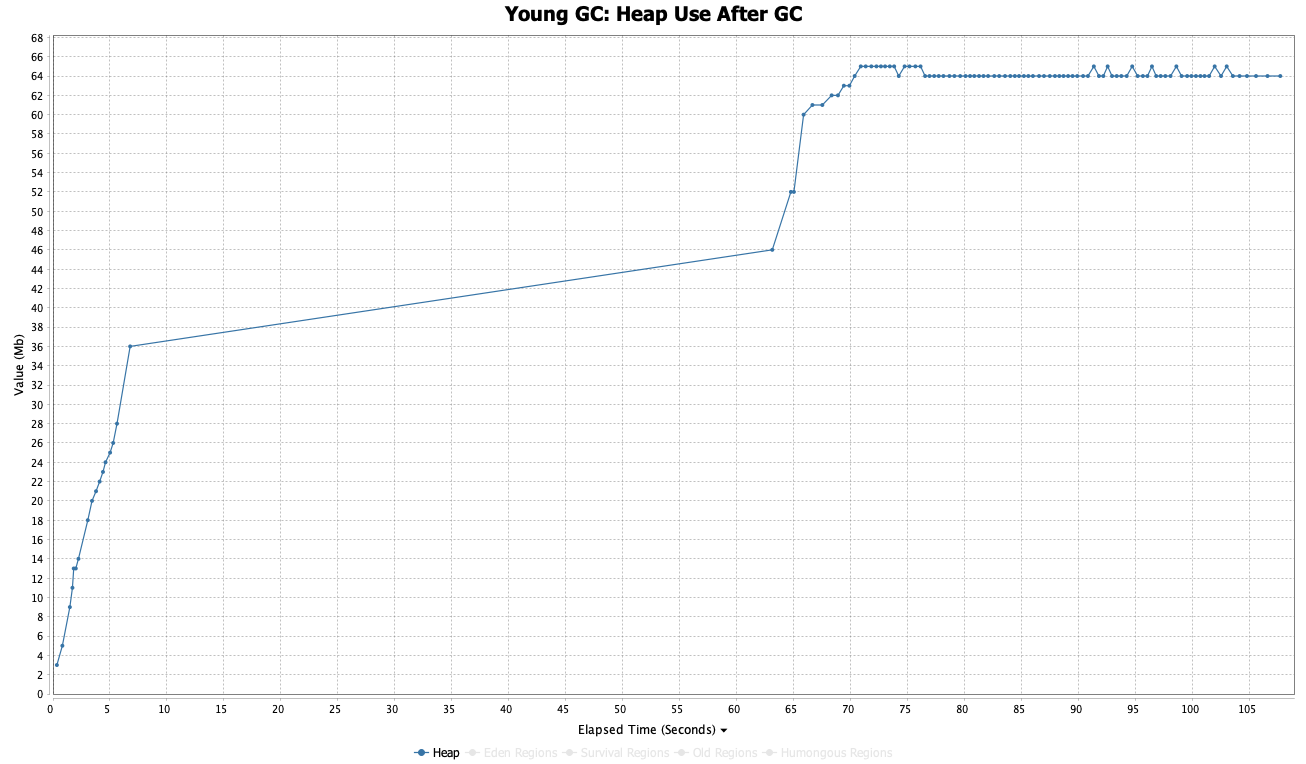
The gc.log file is the “place to be” to learn more about the memory use of our application. With Azul GC Log Analyzer, we can read this file and visualize a set of graphs over time (wall clock and uptime) to inspect the garbage collector, the JIT compiler, system metrics, and more. The following charts show us that the Garbage Collector pause durations stay below 10ms after the initial load, and the heap size after garbage collection stays around 64MB. We advise you to use double that value to dimension your system. So in this case, the application would be able to handle the same load as generated during the test, with 128MB of memory.
You can follow the same principle with your application and re-check the pause durations and heap use after changing the –Xmx setting of your Java runtime, or the memory configuration of your virtual environment.
Differences in GC logs between Azul Zing and Zulu Builds of OpenJDK
With a different internal-only benchmark we created some extra log files to demonstrate the different results provided by version 17 of Azul Zulu and Zing Builds of OpenJDK.
Results with Zulu
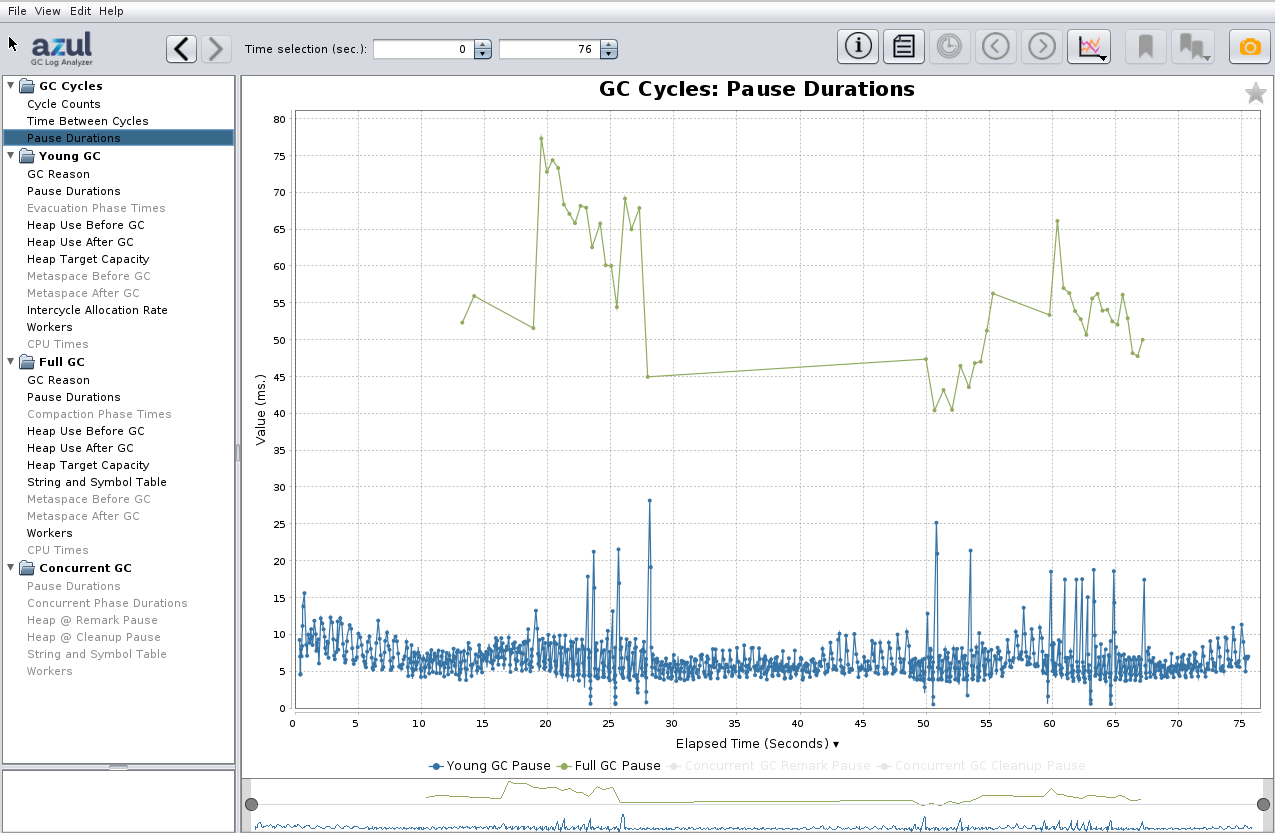
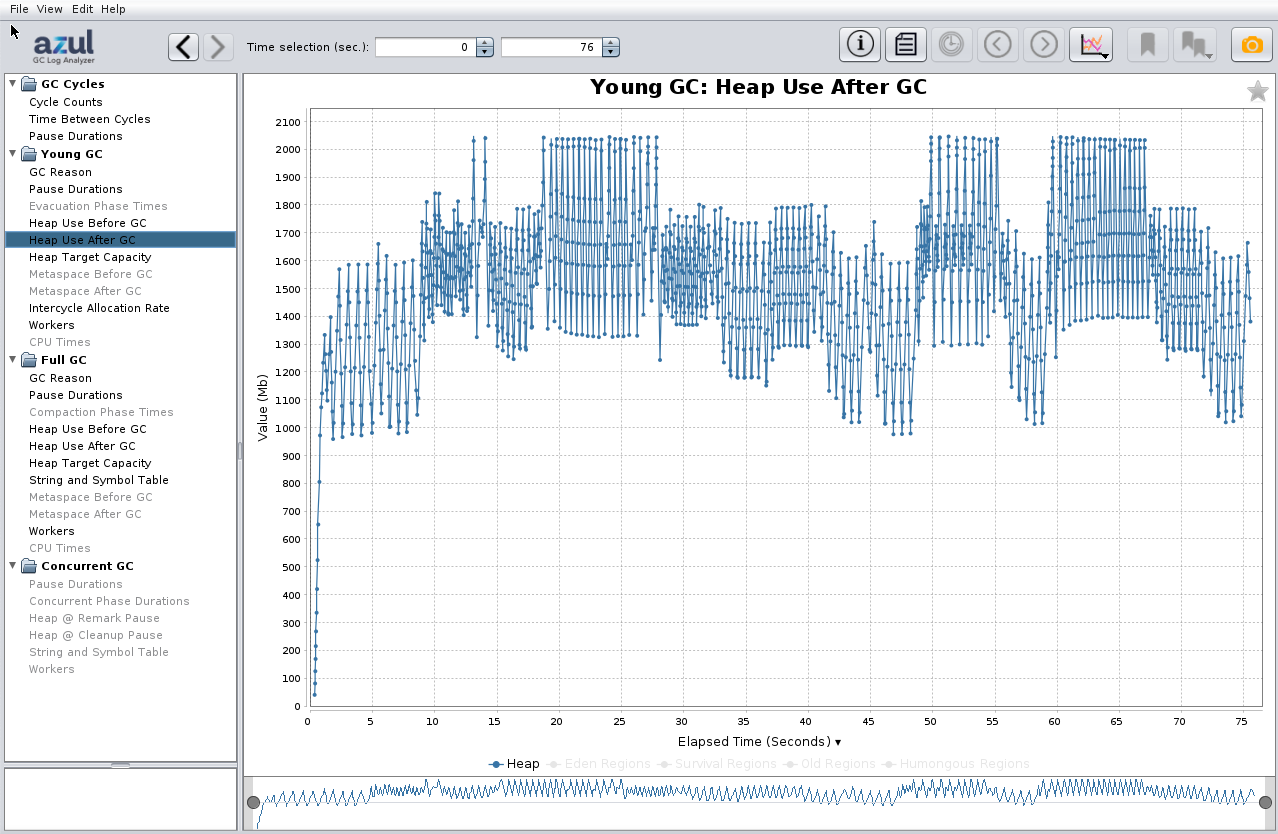
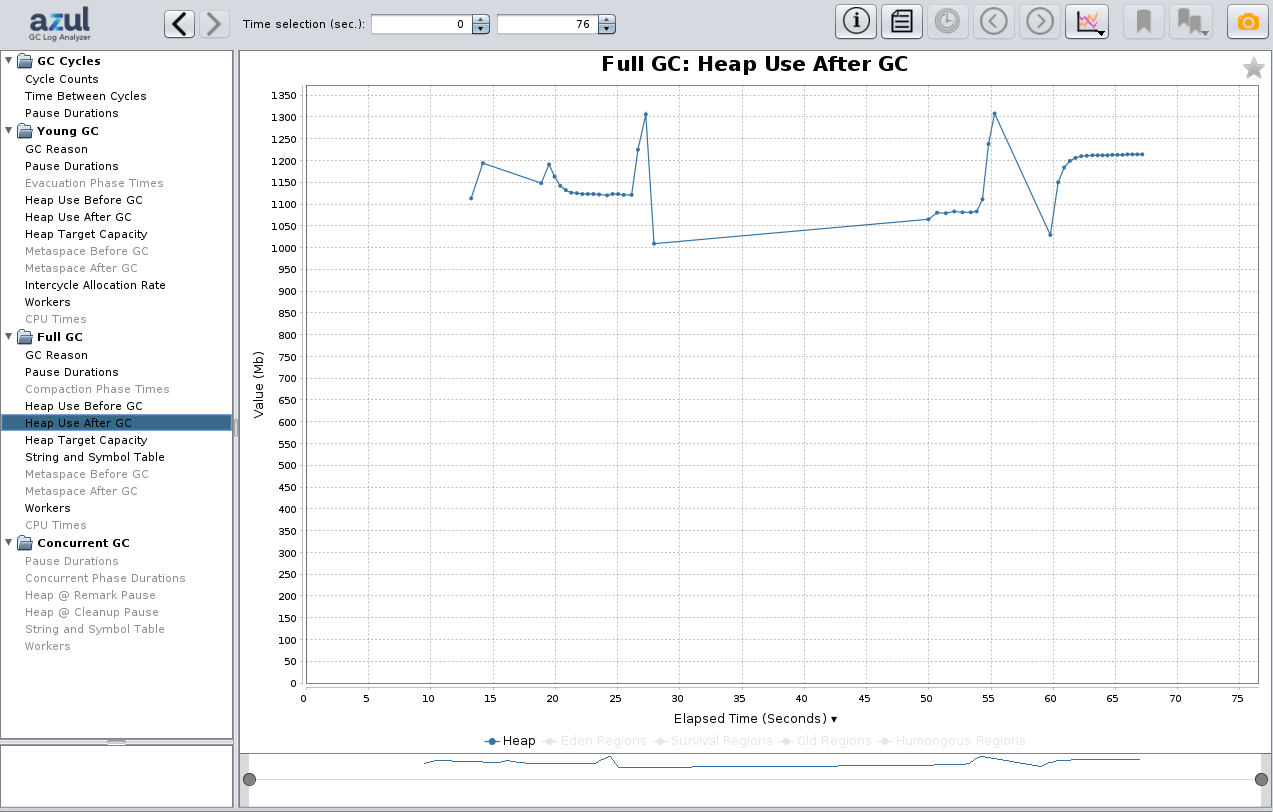
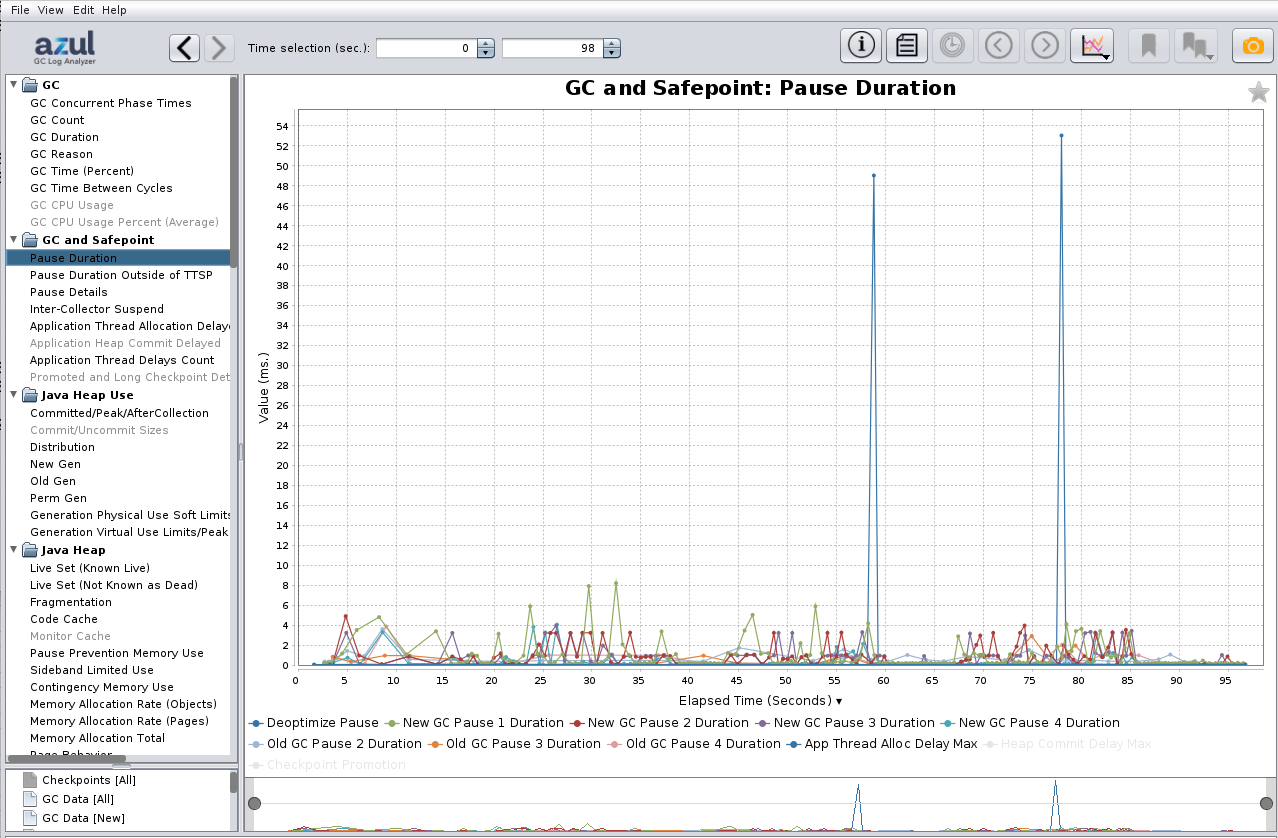
When we generate a GC Log with Zulu, a build of OpenJDK, we get the same data in the log file as most other distributions. The following charts show us that the Garbage Collector pause durations stay below 80ms, and the heap utilization after garbage collection stays around 1 GByte for the long-living objects in Old Generation and 2 GBytes in New Generation for temporary objects. In this specific test case, a total of -Xmx4G is sufficient and actually used, but usually, the standard recommendation would be to set -Xmx to twice the observed heap utilization; here, it would be -Xmx6G.
Results with Zing
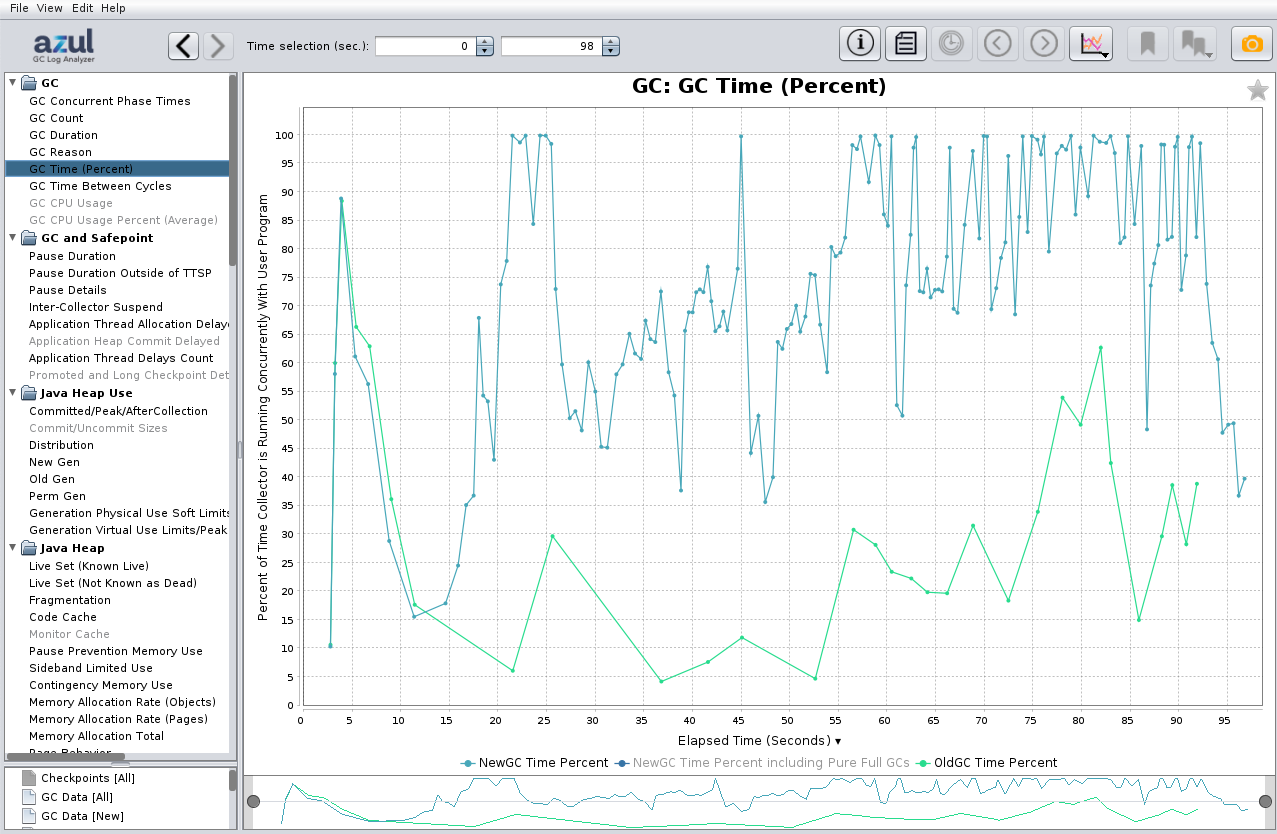
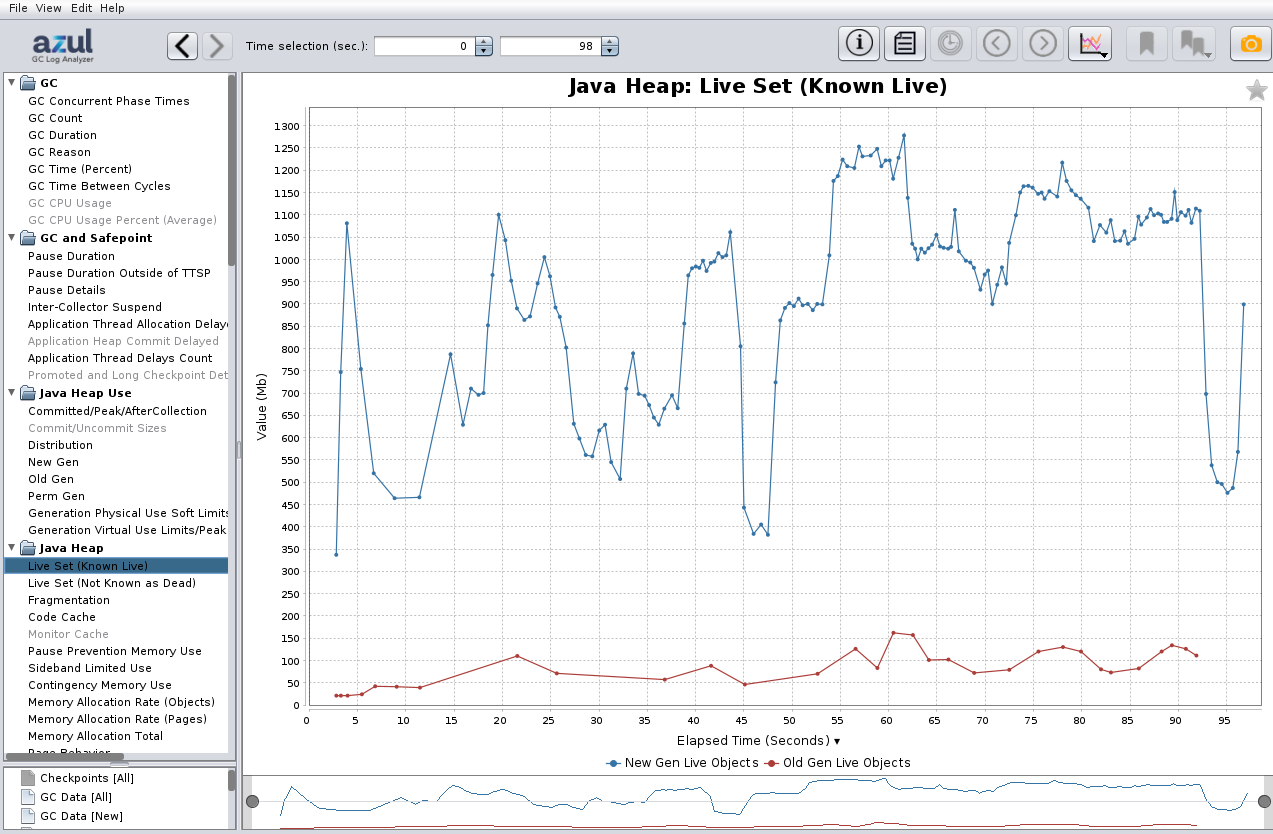
We repeated the same test with Zing, an alternative Java runtime that is based on OpenJDK but has a better JIT compiler (Falcon) and additional garbage collector (C4, Continuously Concurrent Compacting Collector). The graphs look slightly different due to extra information provided by the C4 Garbage Collector. With concurrent GCs, the concurrent duration while the GC is active in parallel to the application is often more important. It doesn’t pause the application but consumes a bit of CPU time. 100% doesn’t mean it consumes 100% of all CPU time as the base 100% is the total number of GC threads, which is less than the number of CPU cores, but staying at 100% for long time periods should be avoided by increasing the heap size. Most of that time is usually spent by the GC to handle temporary objects. Here, in this specific test case, the application performance was still better with Zing compared to Zulu with the same -Xmx4G. For the general sizing, the Live Set graph for Zing is also important as it shows the number of live objects, i.e., without the non-referenced objects, also known as garbage.
Conclusion
Garbage Collector Logging provides the correct metrics to check how much memory an application needs. It is crucial to be able to test the application in the same environment and with a similar load to the production system. Maybe “testing in production” could be the easiest approach to achieve this.


